Why a specimen looks distorted in a hemispherical resin?-Second half
In the first half, we saw the distortion trend “1) the center part was less affected, 2) the middle outer part expanded, and 3) the outer part was compressed. ”
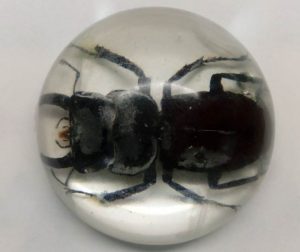
[Figure 1: A stag beetle specimen in hemispherical resin]
Regarding this weird pattern, I aim to capture what is happening using the following tools.
- “Snell’s law” which explains refraction of light
- Free drawing software KSEG
- Excel
Let’s first review the fundamentals of refraction of light. Refraction of light occurs when light in the air enters other substances (water, resin, etc.).
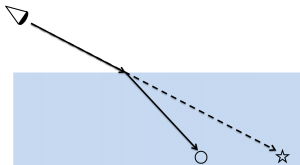 [Figure 2: Basic of refraction of light-1]
When refracted light enters the eye, the viewer recognizes that 〇 is at ☆ due to the optical illusion (the trajectory of refracting light is the same when light enters other substances from the air, and conversely when light enters the air from other substances.).
The situation would be the same with hemispherical resin.
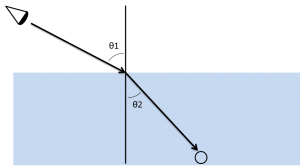 [Figure 3: Basic of refraction of light -2]
The relationship between the incident angle θ1 and the refraction angle θ2 follows the “Snell’s law”.
sin θ 1 / sin θ 2 = n
“n” is an unique value for each material and is called refractive index. The refractive index of epoxy resin, which consists of hemispherical resin, is 1.55 – 1.61. This time I set the refractive index to 1.60.
In order to draw out how refraction of light occurs in hemispherical resin, I used free drawing software “KSEG“. KSEG is convenient software that can be operated easily – drawing straight lines and circles, measuring distances and angles.
The following figure shows a drawing of one of the light path using KSEG.
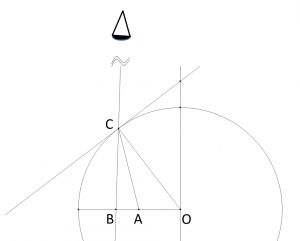
[Figure 4: Drawing one of the light path]
The light from A is refracted at C and reaches the eyes, but actually A looks like at B by the optical illusion.
Then I performed the drawing in Figure 4 for several points. To capture various relationship between A and B, let’s assume that the center of the hemisphere is 0 and the outer edge is 100. The figure below shows the plotting of the relationship between the points A and B.
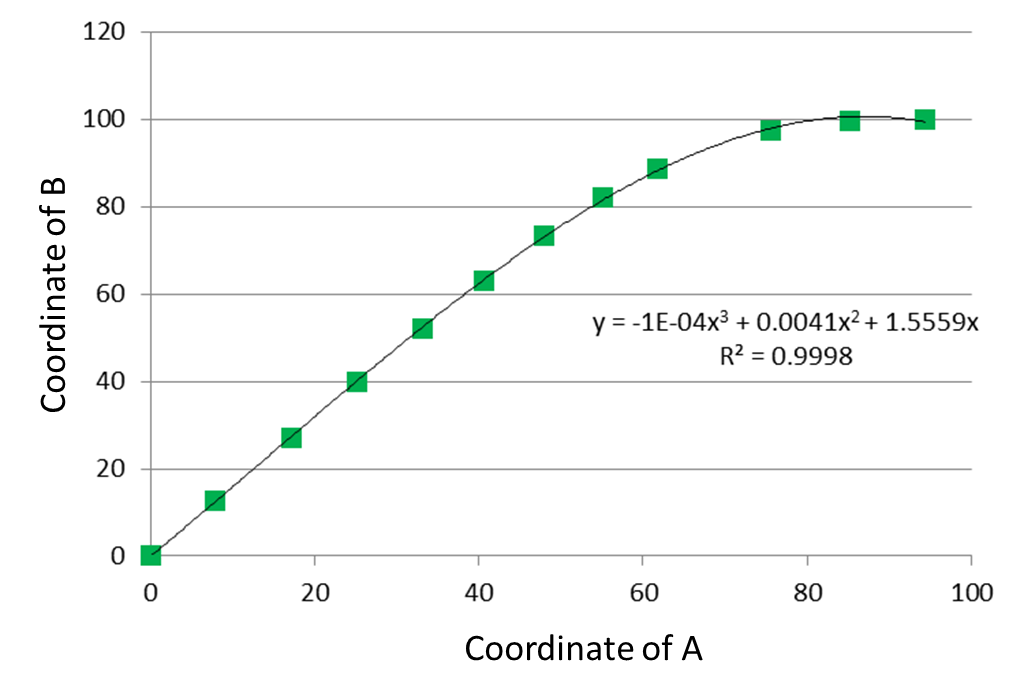
[Figure 5: Coordinate of A and B]
The following is the plot of the distance between A and B (how much it expands).
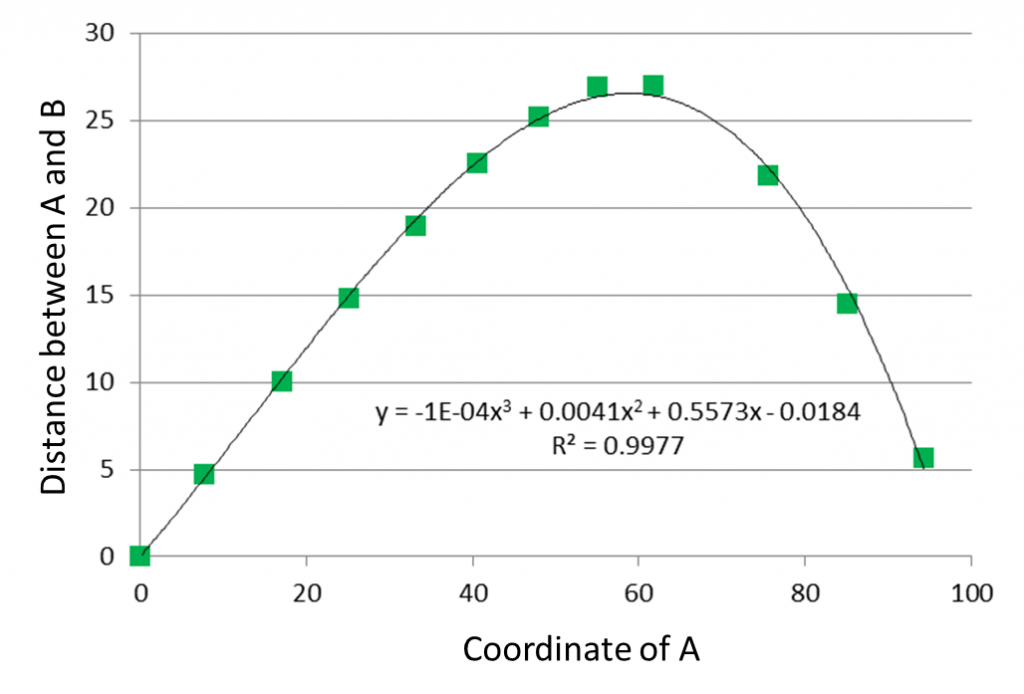
[Figure 6: Distance between A and B]
You can see that the expansion is most intense at about position 60.
The following is the representation of B’s coordinates with respect to A’s coordinates on the number straight line.
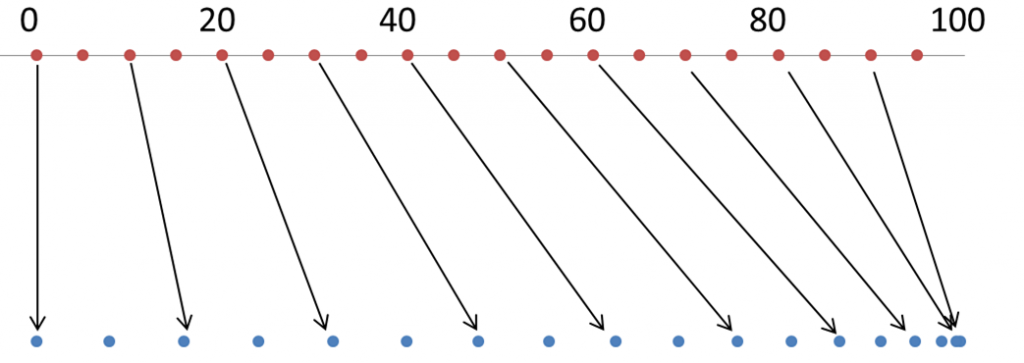
[Figure 7: Coordinate of B with respect to the coordinate of A]
According to Figure 7, I tried to manually process the stag beetle photo (stretching the split images according to the distortion in Figure 7).
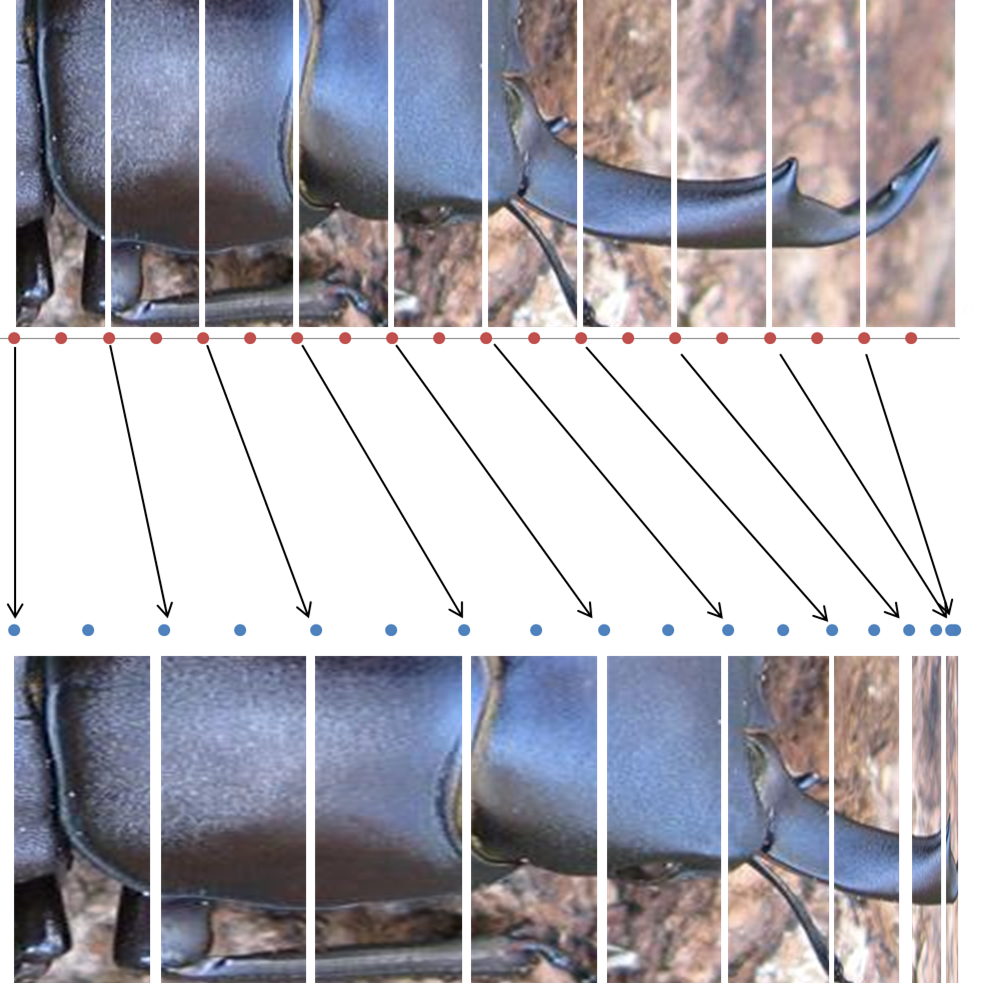
[Figure 8: Manual processing]
I also processed the abdomen part, and whole body to the direction perpendicular to the body axis. Then I jointed the processed sections. Figure 9 shows an unprocessed picture (top), processed picture (middle), and the specimen in hemispherical resin (bottom).
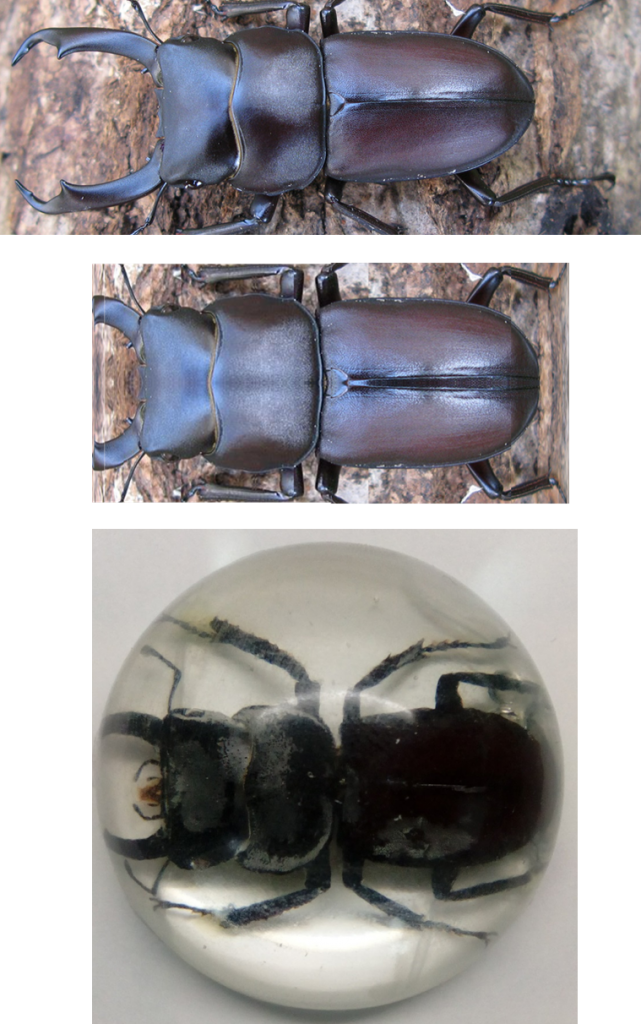
[Figure 9: Distorted image of the stag beetle- Before/after processing and the specimen]
The trend “The distortion is relatively weak in the vicinity of the center, the next largest expansion in the longitudinal and lateral directions, and the tendency to collapse towards the edge further approaching the outside” looks reproduced.
The modeling in Figures 5 to 7 seems to be reasonable.
By using Figure 7, you can see how your specimen looks like when it is buried in hemispherical resin, before actually making it.
The conclusion is the same as the first part, but I believe we were able to capture the whole picture of the distortion.